


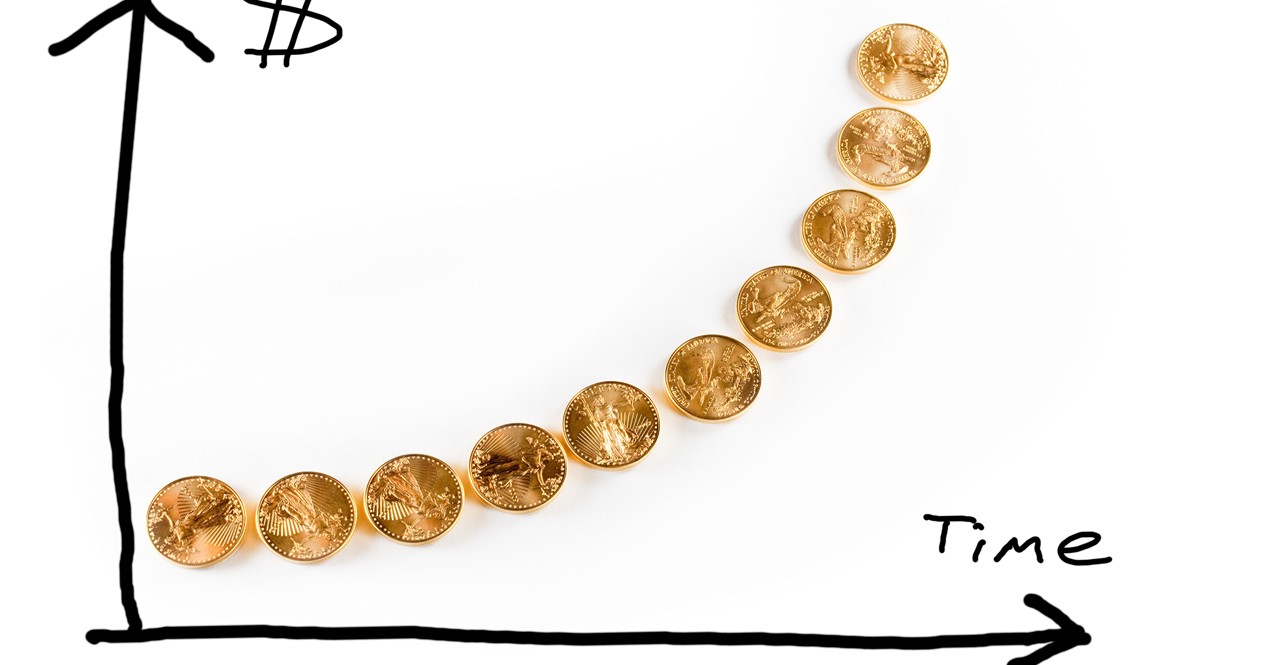
Today I will explain one of the most powerful graphs you will ever see in your whole life.
But before we look at the graph, I can mention that about 60% of Americans invest in stocks and about 50% of Norwegians invest in stock funds.
Few know that the value of their investments in stocks isn't able to keep pace with the money's reduction in purchasing power over a longer period of time, when measured against all types of economic goods.
The reason is that few understand the effect of monetary policy and that their investments compete with an inflation of the money supply which is roughly on average 7% per year, both in the US and in Norway.
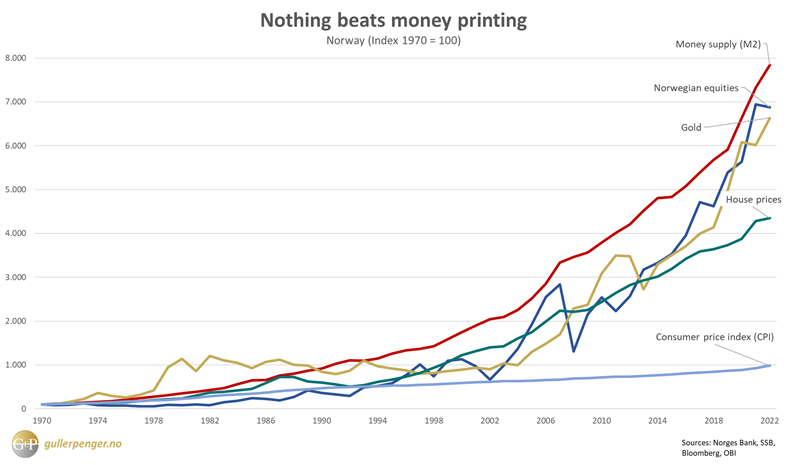
The red line in the graph refers to the official M2 money supply (Norwegian kroner).
The dark blue line is the Oslo Stock Exchange's main index. This includes dividends reinvested.
As you can see the stock index isn't able to keep up with the rate of the money printing.
The dark blue line isn't adjusted for capital gains tax. The more money that is printed, the more the price of the stocks will rise and the more you will have to pay in capital gains tax.
Neither is it adjusted for management fees. Investopedia says that "Management fees can range from as low as 0.10% to more than 2%".
When you take capital gains tax and management costs into account, it's very, very few who can beat the 7% rate of increase in the money supply.
That's why professional traders "gear" their stock investments by borrowing money so they can double or triple the investment and their profits, as they go in and out of stocks.
Access to cheap credit and understanding how the stock market works makes it possible for them to beat the index.
It's the same with large corporations who invest in real estate, factories and other forms of capital. They use cheap credit to make a profit.
The yellow line is the price (NOK) of physical gold. It has performed just slightly below stocks. When you take into account that the risk associated with buying gold is lower than the risk associated with buying stocks, it looks like gold has been a better investment than stocks.
Many people believe they are saving when they buy a house that they can live in. The green line shows that the average nominal price of homes in Norway cannot at all keep up with the rate of money printing. Norwegian households are more indebted than in any other countries, because they have bought into the idea that buying a house is saving, which it in general clearly isn't.
The light blue line at the bottom of the graph is CPI, the Consumer Price Index. This is important, because wages are adjusted by CPI, give or take a few percentage points. The development of wages is far, far lower than the rate of money printing as well as the stock market index, gold and homes. This means, for instance, that buying a home becomes more and more costly in real terms for wage earners as time goes by.
But this is how the monetary policy works. The few who gain from money printing have to make someone pay for it. And this group is the wage earners, ordinary workers like you and me.
Roughly speaking it's the government and the wealthiest 1% of the people who benefit from the money printing. A few more manage to preserve the value of their savings by taking risks and investing their earnings in securities.
The overwhelming majority lose out. We are the ones who finance what the 1-percenters and the government earn from the system.
This is also what explains the ever increasing wealth gap and concentration of economic resources on fewer and fewer hands.
Without this redistributive effect, the government wouldn't bother to have a monetary policy based on inflating the money supply.
Perhaps you now begin to understand that it's no coincidence that those who wake up to this reality become interested in gold and Bitcoin₿.

